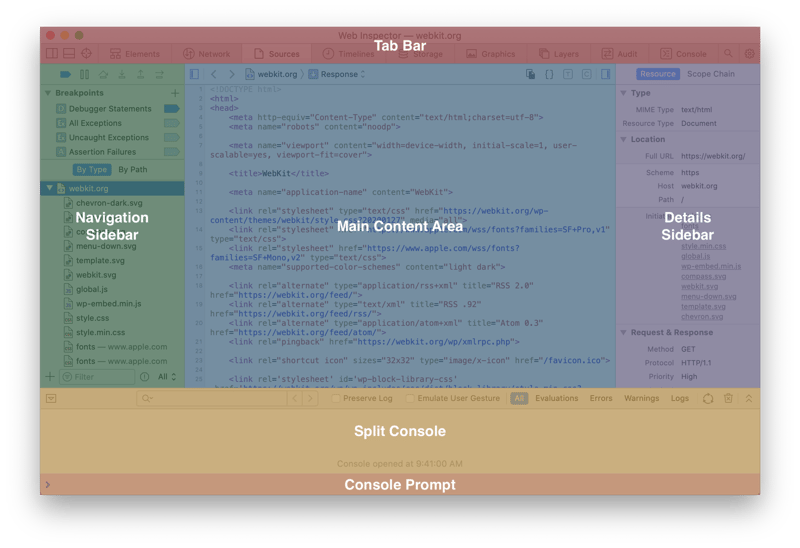
Every JavaScript and web developer is familiar with the “Inspect” feature in their browsers, whether Chrome or Safari. It's a useful tool for debugging web applications, allowing you to identify all the resources and activity on a webpage, including source locations, CSS rules, page metrics, and properties.
WebKit lets you do this on embedded targets, via their Remote Web Inspector. This powerful tool allows you to open up the inspector in your desktop browser and connect to your target embedded platform. Now you have the luxuries of a desktop environment to debug your web application running on an embedded target.
 Web Inspector interface from WebKit's documentation
Try Remote Web Inspector on your embedded target
If you want to try out Remote Web Inspector now, we recommend downloading and installing Google Chrome's developer build, Canary, and launching it with the following option:
chrome --remote-debugging-port=9222
After it's running, launch a second browser and navigate to:
http://localhost:9222
How Remote Web Inspector works
Here's how it works under the hood. The inspector has two main components, the frontend and the backend client. The frontend is simply a JavaScript webpage, which is the user interface for this tool.
The frontend source code is available at WebKit's website here.
The inspector's backend is the agent that interacts with WebKit's engine. The inspector frontend and backend communicate with each other via a JSON-formatted debug protocol.
In the case of the local inspector, the backend calls for receiving and sending messages to/from the frontend are as follows:
Receive message from frontend:
InspectorController::dispatchMessageFromFrontend()
Send message to frontend:
InspectorClient::doDispatchMessageOnFrontendPage(..)
For the Remote Web Inspector, the JSON debug protocol messages are sent over a web socket. To enable this, the tool uses WebInspectorServer, a mini webserver that's able to serve up the inspector frontend, establish a websocket connection for the debug JSON message communications, and tie into the inspector's backend.
The WebInspectorServer listens on a specified port (9222 in the Chrome Canary example above). When you initiate the connection by navigating to the port's landing page (e.g., http://localhost:9222 ), the inspector backend returns a list of webviews. When you load the inspector frontend, WebInspectorServer establishes a web socket connection and notifies the backend that a frontend has been connected.
Note that if you're embedded GUI application has a single-view implementation, you could bypass this and load the inspector frontend directly.
The send and receive functions for the remote communication are as follows:
Receive message from frontend:
WebInspectorProxy::dispatchMessageFromRemoteFrontend(<strong>const</strong> String& message)
Send message to frontend:
WebInspectorProxy::sendMessageToRemoteFrontend(<strong>const</strong> String& message)
Porting Remote Web Inspector to older versions of WebKit
The only downside to the Remote Web Inspector is that it only supports WebKit2. If you're running WebKit, you will need to take the Inspector Server source from WebKit2 and put it into your WebKit directory.
The WebInspectorServer will need to be modified to replace WebInspectorProxy calls with InspectorClient calls.
Depending on the vintage of the port, you may need to grab the changes to WebSockets to support the changes needed to support the WebInspectorServer.
Further reading
- WebKit's Web Inspector page
- For further information on web sockets, check out Mozilla's site
- Debugging with Crank Storyboard
.png?width=180&height=67&name=Crank-AMETEK-HZ-Rev%20(4).png)


