Customers often ask us about Storyboard's performance on specific hardware. What is the maximum number of frames per second that Storyboard can achieve? What is the CPU usage of the engine? And how much memory is required to run an application?
The answer that is given is that this is all configurable, which makes it sound like the questions are being avoided. At that point, the assumption is that the questions are being avoided because the numbers are bad. This is not the case at all. The goal is not to mislead potential customers into thinking that the solution they are getting can achieve 60 frames per second (FPS) on a target while using no CPU or memory. The goal of that answer is to inform potential users of Storyboard that they have options available to them when it comes to achieving the performance that they need to obtain
This article explores several other applications to illustrate how specific design considerations affect engine performance and the ability to achieve particular numbers.
Our goal is to provide insight so that customers considering Storyboard as their UI solution know what they can accomplish with this solution.
All the application run used the following configuration on the NXP RT1050:
- Back buffer to front buffer rendering approach. This means Storyboard renders into the back buffer and copies to the front buffer, which the display reads
- The back buffer is stored in the data tightly coupled memory (DTCM) SRAM section on the board. The DTCM section is incredibly fast for access on the RT1050, making pixels operations quicker. When compositing a screen, a read and a write need to be performed on the pixel, so improving access times affects performance
- The board's pixel pipeline (PXP) chip is used to copy the back buffer to the front buffer. This offloads the transfer of the back buffer to the front buffer from the CPU
- The framebuffers are allocated as 480x272 using two bytes per pixel, which means that each framebuffer requires an allocation of 261120 bytes (255 KB) for storage. There are two framebuffers, the back buffer in DTCM as mentioned above, and the front buffer, which is in SDRAM. This brings the total number of bytes needed to store the framebuffers to 522240 bytes (510 KB). The calculation to calculate framebuffer memory is "width of the framebuffer" * "height of the framebuffer" * "bytes per pixel of the framebuffer." For the configuration above, this would be 480x272x2. This would give the size of one frame buffer. That value can then be multiplied by the number of framebuffers needed to provide the total size required by the framebuffers
- The FreeRTOS OS, with the FreeRTOS tick hertz was set to 1000. This allows for 1ms timer resolution
- The MCUXpresso SDK 2.12.0 version was used
- The Storyboard Runtime version was 7.2.0
BubbleMark
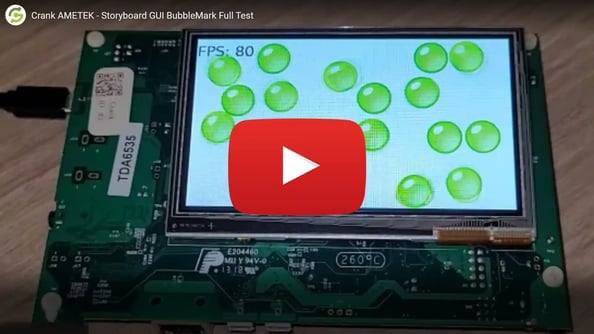
When a new port of Storyboard is brought up on a platform, Bubblemark is one of the first applications to run. This is because the Bubblemark application tests Lua execution and timers. Depending on your preference, it can run flat out, generating a new redraw event as soon as the previous one has been serviced or off a timer so that you can control the frame rate. The engine's default configuration is to run flat out, which limits the top FPS you can expect if the CPU is fully utilized. Here is a video of the application running on the target:
It took 1.66 megabytes (MB) to store this application in a flash. This is the size of the BSP, the runtime, and the assets required to run the application. The images for the application were stored uncompressed in a flash. This was done to cut down on the memory required to draw the image.
The upper limit on this board is around 99 FPS, consuming all the CPU. Here is the performance data recorded from running this application on the RT1050-EVKB for two minutes.
|
MS Elapsed |
CPU Time (MS) |
CPU % |
Frames Rendered |
Render Time (MS) |
Time per Frame (MS) |
FPS |
Memory Used (KB) |
|
10025 |
10025 |
100.00% |
1004 |
5784 |
5.76 |
100.14 |
164.91 |
|
20028 |
10003 |
100.00% |
995 |
5840 |
5.87 |
99.47 |
180.99 |
|
30030 |
10002 |
100.00% |
990 |
5848 |
5.91 |
98.99 |
189.39 |
|
40035 |
10005 |
100.00% |
996 |
5832 |
5.86 |
99.55 |
204.90 |
|
50041 |
10006 |
100.00% |
990 |
5830 |
5.89 |
98.94 |
216.47 |
|
60048 |
10007 |
100.00% |
988 |
5858 |
5.93 |
98.73 |
222.25 |
|
70047 |
9999 |
100.00% |
996 |
5834 |
5.86 |
99.61 |
167.84 |
|
80049 |
10002 |
100.00% |
989 |
5848 |
5.91 |
98.88 |
175.98 |
|
90052 |
10003 |
100.00% |
1000 |
5817 |
5.82 |
99.96 |
195.66 |
|
100061 |
10009 |
100.00% |
1002 |
5791 |
5.78 |
100.12 |
217.64 |
|
110064 |
10003 |
100.00% |
989 |
5848 |
5.91 |
98.87 |
228.04 |
|
120068 |
10004 |
100.00% |
1001 |
5784 |
5.78 |
100.06 |
177.16 |
|
Average |
10005.67 |
100.00% |
995 |
5826.17 |
5.86 |
99.44 |
195.10 |
The legend for the tables used in this document are:
- MS Elapsed: The number of milliseconds that the application has been running
- CPU Time: The amount of time that the CPU was not idle
- CPU %: The percentage of time that the CPU was not idle
- Frames Rendered: The number of frames the Storyboard Engine rendered in 10 seconds
- Render Time (MS): The number of milliseconds out of the 10 seconds the engine spent rendering
- Time per Frame (MS): The average time taken to render one frame
- FPS: The frames per second that the engine achieved
- Memory Used (KB): The number of kilobytes from the heap that the engine used
Looking at the numbers, they correspond to what the application was reporting for an FPS. When the engine runs flat on the board, it achieves an average FPS of 99. There are a couple of things to note about the data. The first is that the average render time per frame is six milliseconds (MS). If the system only performed rendering, that render time would provide 167 frames per second. This fits with the rendering time accounting for the 58% usage time for rendering. The rest, 42%, is being used to calculate hit detection, speed, and direction of the balls through Lua.
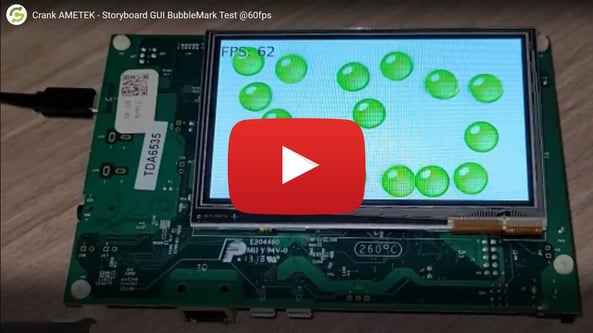
Now that the upper limit has been evaluated, the bubble mark application can be configured to draw every 16 MS. The storage size does not change. The following is a video of the bubble mark application running using a timer to drive the drawing of the frame every 16 MS:
Here is the data recorded from this run:
|
MS Elapsed |
CPU Time (MS) |
CPU % |
Frames Rendered |
Render Time (MS) |
Time per Frame (MS) |
FPS |
Memory Used (KB) |
|
10016 |
5988 |
59.78% |
625 |
3459 |
5.53 |
62.40 |
222.50 |
|
20016 |
6004 |
60.04% |
625 |
3446 |
5.51 |
62.50 |
164.48 |
|
30016 |
6090 |
60.90% |
625 |
3539 |
5.66 |
62.50 |
178.41 |
|
40016 |
6058 |
60.58% |
625 |
3511 |
5.62 |
62.50 |
191.14 |
|
50016 |
6134 |
61.34% |
625 |
3581 |
5.73 |
62.50 |
205.01 |
|
60016 |
6001 |
60.01% |
625 |
3452 |
5.52 |
62.50 |
218.89 |
|
70016 |
6155 |
61.55% |
625 |
3603 |
5.76 |
62.50 |
231.78 |
|
80016 |
6070 |
60.70% |
625 |
3525 |
5.64 |
62.50 |
173.78 |
|
90016 |
6157 |
61.57% |
625 |
3606 |
5.77 |
62.50 |
187.66 |
|
100016 |
6090 |
60.90% |
625 |
3541 |
5.67 |
62.50 |
200.38 |
|
110016 |
6042 |
60.42% |
625 |
3497 |
5.60 |
62.50 |
214.27 |
|
120016 |
6084 |
60.84% |
625 |
3548 |
5.68 |
62.50 |
160.98 |
|
Average |
6072.75 |
60.72% |
625 |
3525.67 |
5.64 |
62.49 |
195.77 |
The CPU usage drops down to an average of 60.72%, which is expected, as the engine is no longer running flat out. It is now breaking to wait until a frame needs to be drawn every 16 MS. The ratio of render time to calculation time remains consistent at 58% to 42%. The system is now idle for 39% of the time as the CPU is not needed during that time, and the engine is dormant during that time, waiting for the timer to fire before it needs to draw again.
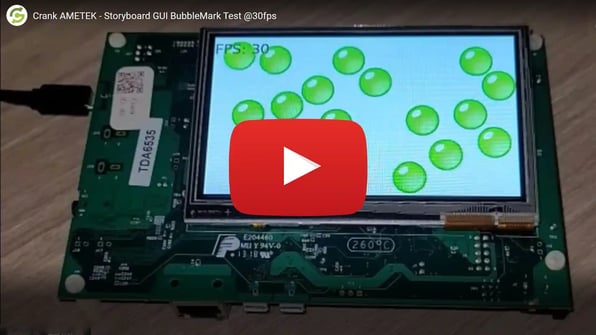
The next step after that is to see what the application looks like when it is throttled to draw at 30 FPS, which is achieved by setting the timer to fire every 33 MS. Here is a video of what the app looks like running at 30 FPS:
Here is the data recorded from this run:
|
MS Elapsed |
CPU Time (MS) |
CPU % |
Frames Rendered |
Render Time (MS) |
Time per Frame (MS) |
FPS |
Memory Used (KB) |
|
10016 |
2917 |
29.12% |
305 |
1699 |
5.57 |
30.45 |
206.00 |
|
20016 |
2890 |
28.90% |
303 |
1659 |
5.48 |
30.30 |
202.13 |
|
30016 |
2896 |
28.96% |
303 |
1660 |
5.48 |
30.30 |
198.67 |
|
40016 |
2914 |
29.14% |
303 |
1676 |
5.53 |
30.30 |
194.27 |
|
50016 |
2939 |
29.39% |
303 |
1702 |
5.62 |
30.30 |
189.42 |
|
60016 |
2961 |
29.61% |
303 |
1730 |
5.71 |
30.30 |
189.43 |
|
70016 |
2890 |
28.90% |
303 |
1656 |
5.47 |
30.30 |
185.95 |
|
80016 |
2985 |
29.85% |
303 |
1753 |
5.79 |
30.30 |
181.32 |
|
90016 |
2950 |
29.50% |
303 |
1717 |
5.67 |
30.30 |
176.70 |
|
100016 |
2961 |
29.61% |
303 |
1721 |
5.68 |
30.30 |
172.04 |
|
110016 |
2936 |
29.36% |
303 |
1700 |
5.61 |
30.30 |
168.55 |
|
120016 |
2858 |
28.58% |
303 |
1622 |
5.35 |
30.30 |
163.90 |
|
Average |
2924.75 |
29.24% |
303.17 |
1691.25 |
5.58 |
30.31 |
185.70 |
Again, there is a drop in CPU usage, which is now 29.24% on average. Based on previous configurations of this application, we observed a 58% to 42% split between rendering and calculation code.
Now, with the timer approach to updating the positions of the controls, there are no frames to drop, which is why the movement looks slower when the timer interval is set to 33 MS. There is a way to configure the engine to provide smooth animations while using less CPU. This will be highlighted in the next section.
Hello World
The Hello World Storyboard application is a simple application that runs a couple of animations. It is an excellent test to ensure that the animation plugin works properly when running Storyboard on a new platform. Here is a video of this application running on the hardware:
The Hello World application takes up 2.45 MB of flash space. The following is a table that shows the metrics for this application while it was running for 2 minutes:
|
MS Elapsed |
CPU Time (MS) |
CPU % |
Frames Rendered |
Render Time (MS) |
Time per Frame (MS) |
FPS |
Memory Used (KB) |
|
10006 |
1009 |
10.08% |
196 |
1023 |
5.22 |
19.59 |
113.49 |
|
20006 |
630 |
6.30% |
133 |
621 |
4.67 |
13.30 |
114.70 |
|
30006 |
627 |
6.27% |
133 |
616 |
4.63 |
13.30 |
114.70 |
|
40007 |
792 |
7.92% |
158 |
782 |
4.95 |
15.80 |
114.64 |
|
50007 |
654 |
6.54% |
144 |
646 |
4.49 |
14.40 |
114.64 |
|
60007 |
635 |
6.35% |
134 |
623 |
4.65 |
13.40 |
114.64 |
|
70007 |
628 |
6.28% |
133 |
619 |
4.65 |
13.30 |
114.64 |
|
80007 |
642 |
6.42% |
141 |
631 |
4.48 |
14.10 |
114.64 |
|
90010 |
768 |
7.68% |
181 |
750 |
4.14 |
18.09 |
114.70 |
|
100009 |
914 |
9.14% |
172 |
905 |
5.26 |
17.20 |
114.70 |
|
110009 |
631 |
6.31% |
133 |
622 |
4.68 |
13.30 |
114.70 |
|
120009 |
629 |
6.29% |
133 |
623 |
4.68 |
13.30 |
114.70 |
|
Average |
713.25 |
7.13% |
149.25 |
705.08 |
4.71 |
14.92 |
114.57 |
This application does an excellent job of highlighting one of the core strengths of the Storyboard engine. The Storyboard engine is event-driven. In the absence of events, the engine does nothing. The screen does not need to be rendered if no events occur, which means no data needs to be updated. Therefore, the FPS numbers in the table may seem low, but that is the exact number of updates to the screen required to achieve the animation effect that the Designer was hoping for. The following screenshots show the design of the animations.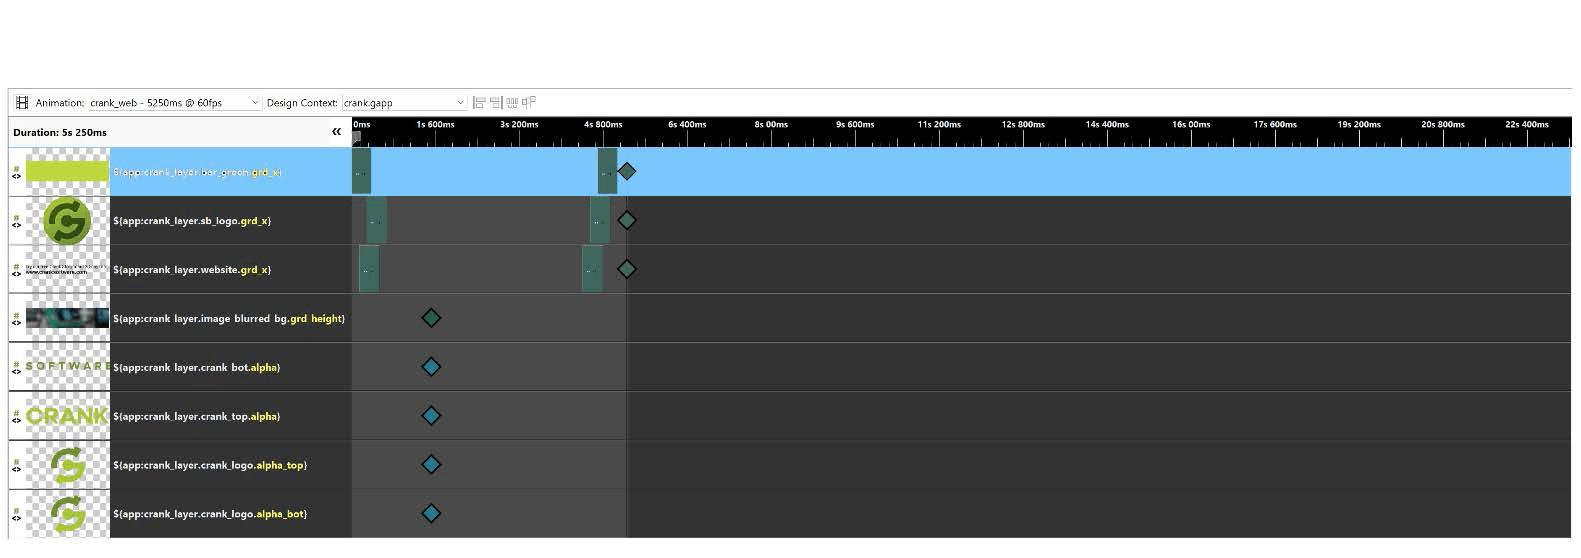
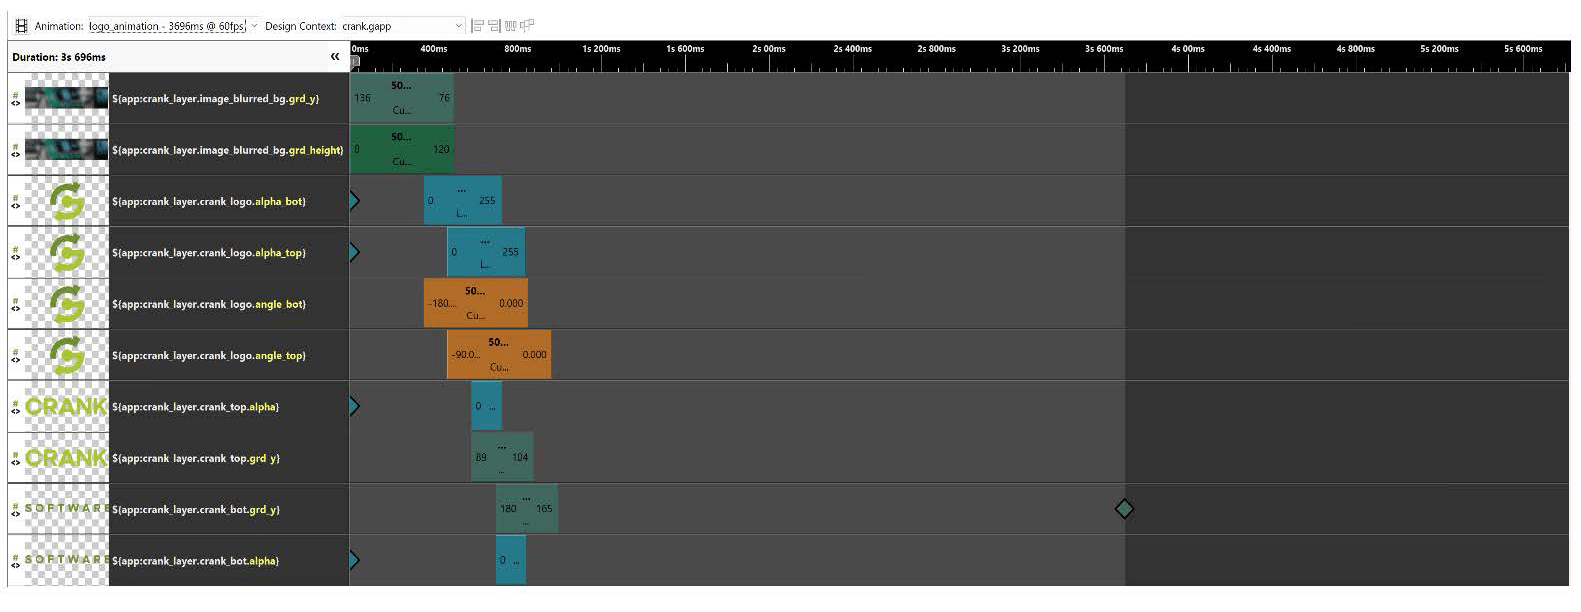
The animation design shows large blocks without any data change. These are times when the engine will stay idle, giving other threads in the system a chance to use the CPU without compromising the smoothness of the animation. This can be verified by looking at the CPU utilization numbers while running the Hello World application. The CPU usage stays below 10% for running this application.
Infinite List
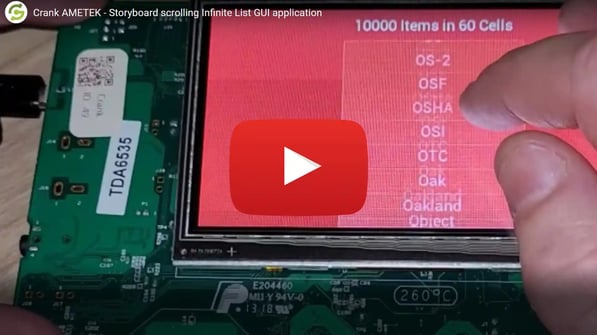
Smooth scrolling lists have been a requirement in user interfaces since Apple released its first iPhone. There is a sample application provided in Storyboard called Infinite List. This application demonstrates how to create an extensive list of items, in this case, 10000 items, and shows them in groups of 60 items at a time. The sample was created to show how to create a scrollable list in Storyboard that is smooth and responsive. Here is a video of the Infinite List sample application running on the RT1050-EVKB:
The Infinite List sample takes 1.96 MB of flash to store. The following table shows the metrics for the engine while scrolling through the list:
|
MS Elapsed |
CPU Time (MS) |
CPU % |
Frames Rendered |
Render Time (MS) |
Time per Frame (MS) |
FPS |
Memory Used (KB) |
|
10030 |
6600 |
65.80% |
351 |
6340 |
18.06 |
35.00 |
1892.94 |
|
20029 |
7868 |
78.69% |
337 |
6983 |
20.72 |
33.70 |
946.95 |
|
30029 |
7524 |
75.24% |
402 |
7279 |
18.11 |
40.20 |
1279.70 |
|
40039 |
6666 |
66.59% |
355 |
6360 |
17.92 |
35.46 |
1410.55 |
|
50047 |
7648 |
76.42% |
404 |
7408 |
18.34 |
40.37 |
1318.91 |
|
60058 |
8089 |
80.80% |
426 |
7860 |
18.45 |
42.55 |
1252.73 |
|
70073 |
7784 |
77.72% |
420 |
7524 |
17.91 |
41.94 |
1478.62 |
|
80082 |
7105 |
70.99% |
377 |
6807 |
18.06 |
37.67 |
1059.38 |
|
90093 |
7682 |
76.74% |
408 |
7420 |
18.19 |
40.76 |
910.39 |
|
100095 |
8417 |
84.15% |
446 |
8199 |
18.38 |
44.59 |
994.09 |
|
110095 |
3561 |
35.61% |
169 |
3123 |
18.48 |
16.90 |
916.30 |
|
120095 |
567 |
5.67% |
0 |
0 |
0.00 |
0.00 |
916.30 |
|
Average |
6625.92 |
66.20% |
341.25 |
6275.25 |
16.88 |
34.09 |
1198.07 |
Few things to note about the metrics: The first is that drawing text is more intensive than drawing images. The reason is that new text needs to be resized in order to be positioned properly in the rendered area. Additionally, the text has an alpha blending component since the font engine provides glyphs as alpha values that determine which pixels require drawing and which do not. Each pixel in the glyph needs to be colored with the chosen text color. This can lead to higher CPU usage as the new text items are being loaded into the list.
Also of note is the last entry in the table. At this point in the execution of the application, the list was left alone for 10 seconds. The engine did not render anything at this point and was idle. However, the CPU had a usage percentage of 5.67%. This was due to the input thread that got information from the touch screen. The way the CPU usage was calculated during the running of the applications was to look at the time that the CPU was idle. This means that any thread running on the system would count as CPU usage. The touchscreen driver used in this case did not support an interrupt-driven approach to reading data, which meant that the device needed to be polled for data.
Polling for data suggests that the thread will wake up at a defined interval, check the device for data, and if there is none, go back to sleep for the defined amount of time. This polling interval is why there is a 5.67% CPU usage and is not tied to the Storyboard engine. Any graphics engine that required touch input using this method would see some CPU usage from the input thread, where the usage would be based on the polling interval. The Bubblemark and Hello World applications did not need the input thread, so the CPU usage numbers reported for those applications are strictly what the Storyboard engine needs.
CoffeeApp
The CoffeeApp demo provides a way to compare Lua scripting to C code implementations for creating dynamic responses to events. The C code callback action offers an action that will call a C code function when an event occurs. The C code API for Storyboard is a low memory option compared to Lua, but the Lua API is richer in terms of API functionality. Simply put, fewer convenience functions are defined for the C code API because those functions require more memory.
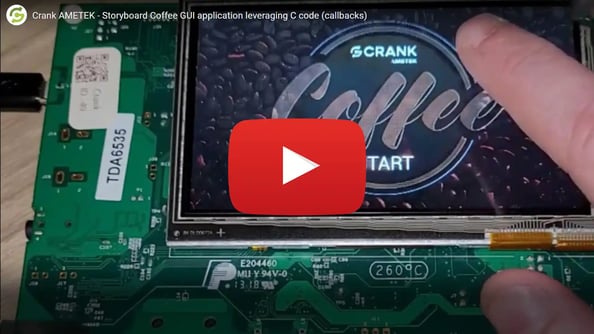
Here is a video of the CoffeeApp demo running with C callbacks:
To store this application on the RT1050-EVKB it took 4.51 MB of flash memory. Here are the metrics for running the CoffeeApp demo on the target:
|
MS Elapsed |
CPU Time (MS) |
CPU % |
Frames Rendered |
Render Time (MS) |
Time per Frame (MS) |
FPS |
Memory Used (KB) |
|
10011 |
9430 |
94.20% |
533 |
9318 |
17.48 |
53.24 |
125.31 |
|
20011 |
5912 |
59.12% |
461 |
5699 |
12.36 |
46.10 |
172.76 |
|
30011 |
7303 |
73.03% |
531 |
7195 |
13.55 |
53.10 |
175.23 |
|
40012 |
3570 |
35.70% |
351 |
3329 |
9.48 |
35.10 |
177.07 |
|
50012 |
6947 |
69.47% |
505 |
6810 |
13.49 |
50.50 |
175.32 |
|
60014 |
3374 |
33.73% |
321 |
3124 |
9.73 |
32.09 |
176.09 |
|
70014 |
6841 |
68.41% |
568 |
6715 |
11.82 |
56.80 |
182.06 |
|
80014 |
4331 |
43.31% |
332 |
4090 |
12.32 |
33.20 |
181.79 |
|
90019 |
6926 |
69.23% |
586 |
6790 |
11.59 |
58.57 |
182.06 |
|
100019 |
3855 |
38.55% |
274 |
3618 |
13.20 |
27.40 |
178.13 |
|
110021 |
6028 |
60.27% |
500 |
5849 |
11.70 |
49.99 |
182.07 |
|
120023 |
5362 |
53.61% |
380 |
5179 |
13.63 |
38.00 |
178.12 |
|
Average |
5823.25 |
58.22% |
445.17 |
5643.00 |
12.53 |
44.51 |
173.83 |
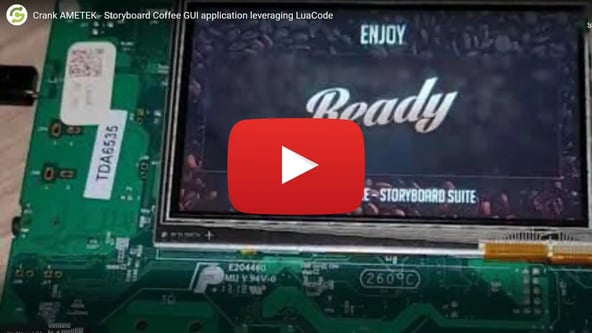
As a comparison, here is a video of the application running using Lua callbacks instead of C callbacks:
To store the version of the CoffeeApp demo that uses Lua callbacks on the device, it took 4.68 MB of flash memory. Here are the metrics for running the CoffeeApp demo using Lua callbacks on the target:
|
MS Elapsed |
CPU Time (MS) |
CPU % |
Frames Rendered |
Render Time (MS) |
Time per Frame (MS) |
FPS |
Memory Used (KB) |
|
10010 |
9423 |
94.14% |
531 |
9297 |
17.51 |
53.04 |
170.55 |
|
20022 |
6013 |
60.06% |
490 |
5784 |
11.80 |
48.95 |
228.74 |
|
30022 |
7011 |
70.11% |
435 |
6817 |
15.67 |
43.50 |
223.43 |
|
40027 |
4619 |
46.17% |
445 |
4390 |
9.87 |
44.47 |
230.55 |
|
50027 |
7602 |
76.02% |
490 |
7417 |
15.14 |
49.00 |
228.81 |
|
60027 |
3354 |
33.54% |
344 |
3094 |
8.99 |
34.40 |
234.47 |
|
70041 |
8168 |
81.57% |
566 |
7994 |
14.12 |
56.52 |
235.07 |
|
80041 |
2768 |
27.68% |
234 |
2500 |
10.68 |
23.40 |
245.91 |
|
90050 |
6335 |
63.29% |
530 |
6133 |
11.57 |
52.95 |
246.18 |
|
100060 |
4585 |
45.80% |
342 |
4368 |
12.77 |
34.17 |
246.36 |
|
110063 |
6571 |
65.69% |
506 |
6346 |
12.54 |
50.58 |
251.46 |
|
120066 |
4767 |
47.66% |
347 |
4561 |
13.14 |
34.69 |
251.65 |
|
Average |
5934.67 |
59.31% |
438.33 |
5725.08 |
12.82 |
43.81 |
232.76 |
When comparing the metrics from the CoffeeApp run with C callbacks and the CoffeeApp run with Lua callbacks, the numbers generally remain the same for CPU utilization and rendering time. Still, by using C callbacks, 58.93 KB of RAM was saved.
This demo application utilizes circles and alpha blending to achieve the graphical look and feel seen in the UI.
These rendering techniques require a little more CPU to accomplish the rendering.
Home Controls
The Home Controls demo application is designed to emulate a real-world UI for an application. The demo has multiple screens that provide users with data about a system.
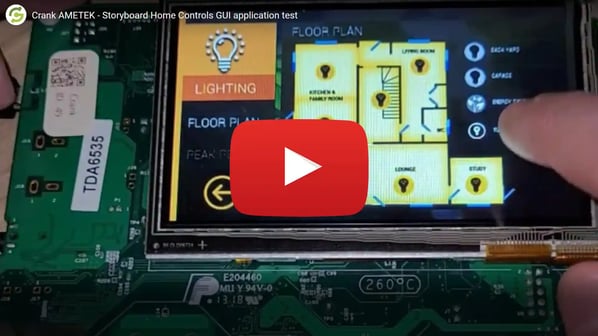
Here is a video of this application running on the RT1050-EVKB:
To store this application on the RT1050-EVKB it took 9.13 MB of flash. Here are the metrics from the system while running the Home Controls demo:
|
MS Elapsed |
CPU Time (MS) |
CPU % |
Frames Rendered |
Render Time (MS) |
Time per Frame (MS) |
FPS |
Memory Used (KB) |
|
10015 |
288 |
2.88% |
1 |
17 |
17 |
0.10 |
302.02 |
|
20015 |
2392 |
23.92% |
341 |
2126 |
6.23 |
34.10 |
377.88 |
|
30015 |
2881 |
28.81% |
465 |
2601 |
5.59 |
46.50 |
479.49 |
|
40015 |
2459 |
24.59% |
358 |
2122 |
5.93 |
35.80 |
514.51 |
|
50015 |
2396 |
23.96% |
311 |
2103 |
6.76 |
31.10 |
597.81 |
|
60019 |
2073 |
20.72% |
293 |
1802 |
6.15 |
29.29 |
602.12 |
|
70019 |
2396 |
23.96% |
396 |
2130 |
5.38 |
39.60 |
627.20 |
|
80019 |
1745 |
17.45% |
249 |
1479 |
5.94 |
24.90 |
594.91 |
|
90019 |
2233 |
22.33% |
449 |
1971 |
4.39 |
44.90 |
611.36 |
|
100020 |
2054 |
20.54% |
312 |
1757 |
5.63 |
31.20 |
612.77 |
|
110020 |
3423 |
34.23% |
503 |
3192 |
6.35 |
50.30 |
618.63 |
|
120023 |
3356 |
33.55% |
504 |
3070 |
6.09 |
50.38 |
675.88 |
|
Average |
2308.00 |
23.08% |
348.50 |
2030.83 |
6.79 |
34.85 |
551.21 |
There isn't anything notable about the Home Control application when it comes to the approach or design of the application. It was a demo created to act like a typical UI application. It uses Lua for the dynamic aspects of the UI, has multiple screens, uses animations to provide effects, etc.
Conclusion
As can be seen from the metrics from the different applications that have been run on the RT1050-EVKB, Storyboard has many ways to build up a UI. There is the choice of C callbacks or Lua for the dynamic aspect of the UI, or whether to build an animation using the animation timeline in Designer or using a timer in the application. These choices allow a user of Storyboard to chart their own course and make decisions on how the UI will be built up so that the result matches the look and feel that the graphical designer was intending.
Storyboard is event-driven, and this architecture allows for an engine that will do nothing unless told to. This allows the engine to conserve resources on a target machine that may be limited. The engine is plugin based, which means that features that are not used can be removed from the engine, which will save on storage.
These are the reasons that when a potential customer asks for the amount of CPU or memory that are required by the engine, the answer that it is configurable is given, because the choices that the engine offer allow the user to choose which course best suits them when building the UI.
.png?width=180&height=67&name=Crank-AMETEK-HZ-Rev%20(4).png)

