.png?width=180&height=67&name=Crank-AMETEK-HZ-Rev%20(4).png)

Interested in implementing a trend graph or similar screen in your Storyboard interface but don't know how? Wonder no longer!
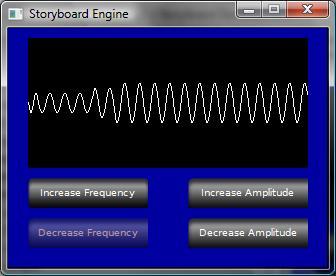
This screenshot is of a sample I posted over in our forums. It runs a rolling Sine wave with alterable frequency/amplitude. The mechanism is fairly simple, but demonstrates how to generate and use dynamic polygon points with the polygon render extension.
There is a polygon render extension in the main part of the screen, with its polygon points tied to a variable. The meat of the application is a timer which ticks every 50ms and generates an event to run a Lua script. The Lua script does some quick calculations to generate a new point, and then creates a string containing all the polygon point data to update the render extensions variable with.
The Lua script is fairly simple: It maintains a rolling list of "y" values, which get assigned to different x locations on each pass through the function. After generating a new (x,y) pair, it then uses the Lua string concatenation to generate the needed string format for polygon points.
The same basic concepts can be used to do all kinds of trend graphs or similar designs. Experiment with it and create your own!